Axxess Hospice now provides a robust Schedule Dashboard that tracks and displays scheduling data in real time.
The new Schedule Dashboard enables users to continuously monitor scheduled tasks, patient frequencies and visit activity, so organizations can streamline scheduling processes, optimize care delivery and stay compliant.
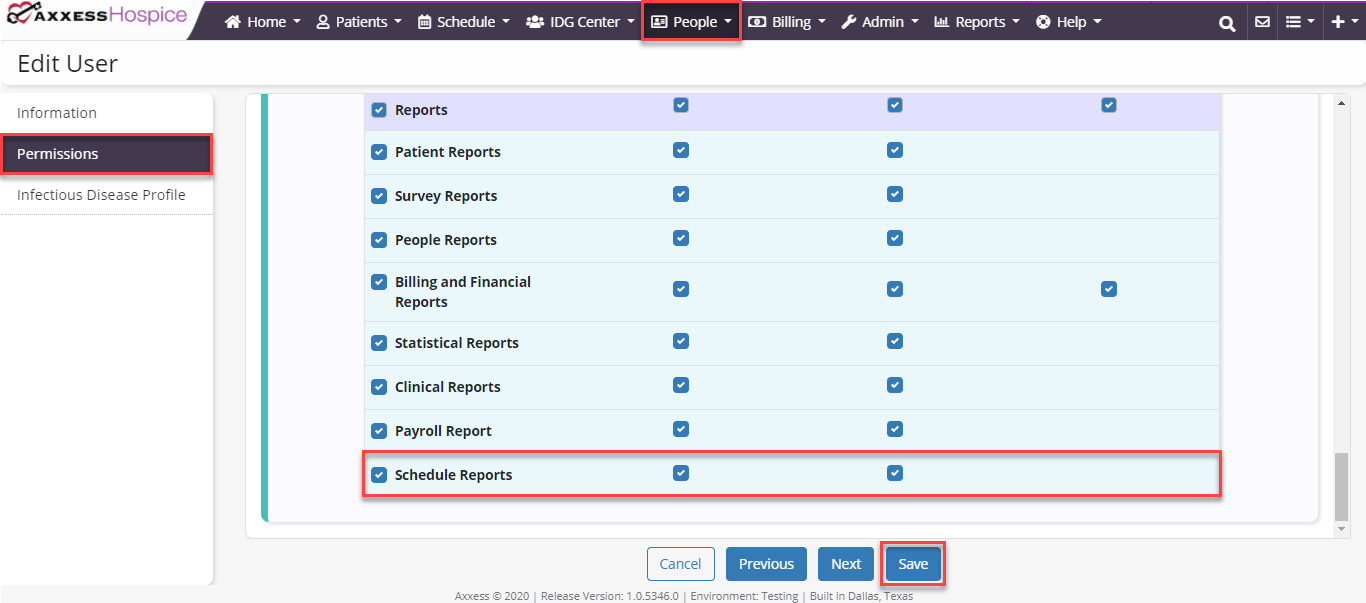
To access the Schedule Dashboard, users must have permission to view schedule reports.
To give a user permission to view schedule reports, edit the user’s profile and navigate to the Permissions tab. In the Reports section, select View next to the Schedule Reports permission. To give the user permission to export schedule reports, select Export. Click Save to finish granting the permissions to the user.
People tab ➜ People Center ➜ Edit ➜ Permissions tab ➜ Reports section ➜ Schedule Reports ➜ View/Export ➜ Save
To access the Schedule Dashboard, navigate to the Schedule tab or Reports tab and select Schedule Dashboard.
Schedule/Reports tab ➜ Schedule Dashboard
The Schedule Dashboard provides real-time data for scheduled tasks, patient frequencies and visit activity, with actionable widgets that enable users to open filtered and full schedule reports and navigate directly to scheduled tasks.
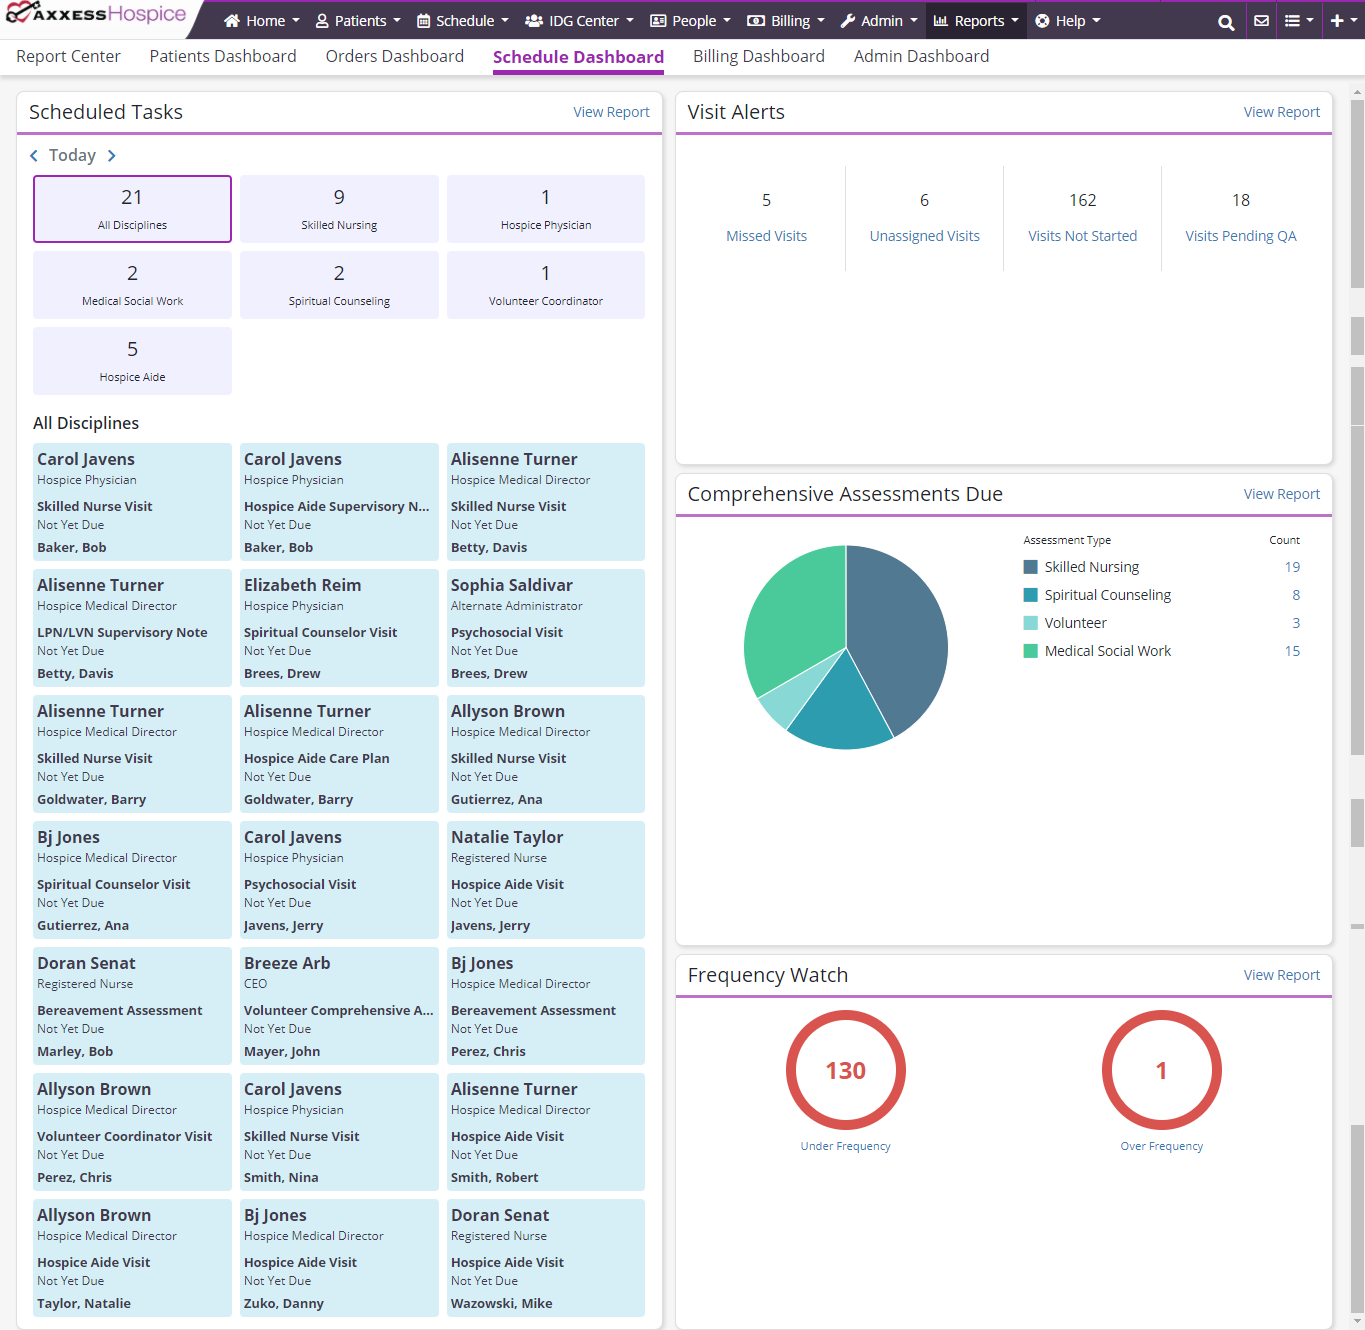
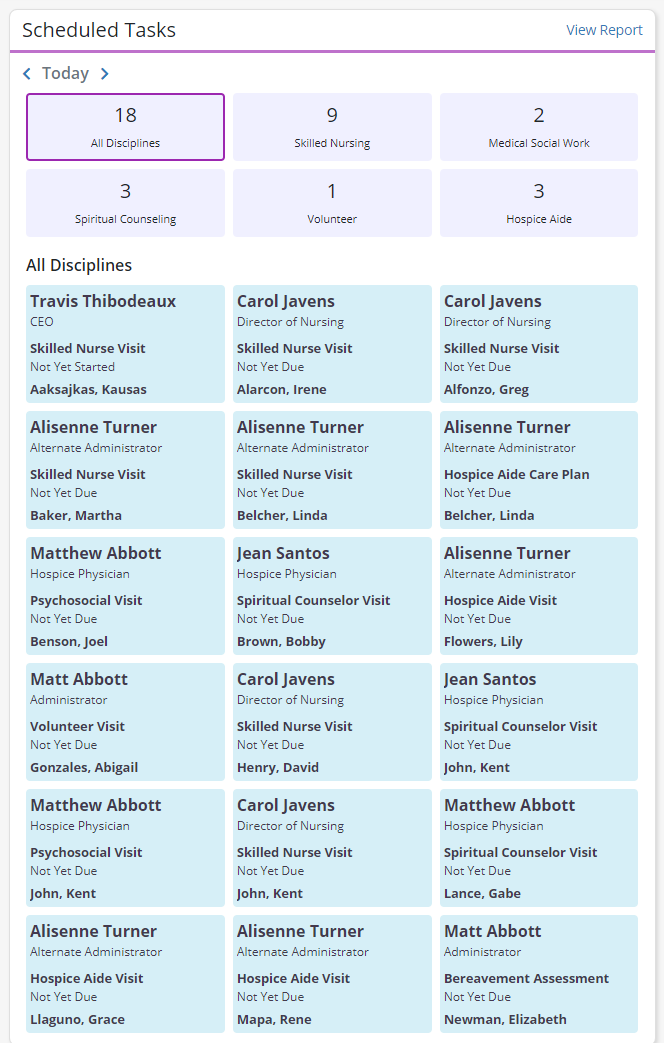
The Scheduled Tasks tile displays tasks scheduled for the selected date. When the Schedule Dashboard is opened, the date defaults to the current day. Click the arrow buttons in the top left corner of the tile to view tasks scheduled for past or future dates.
The top portion of the tile displays the total number of scheduled tasks for each discipline. Task tiles for of all disciplines are listed under the discipline totals. Each task tile shows the assigned user’s name and title, the type of visit scheduled, the real-time visit status and the patient’s name. Click on a task tile to open a task. Click View Report to view the full Scheduled Tasks report.
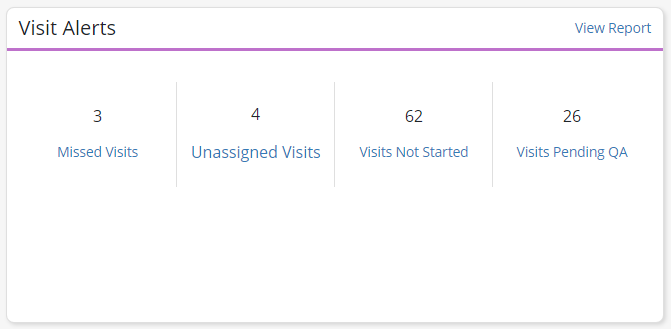
The Visit Alerts tile displays the total number of missed visits, unassigned visits, visits not started and visits pending QA. Click on any of the visit tiles to view the Visit Alerts report filtered by the selected visit type, or click View Report to open the full report.
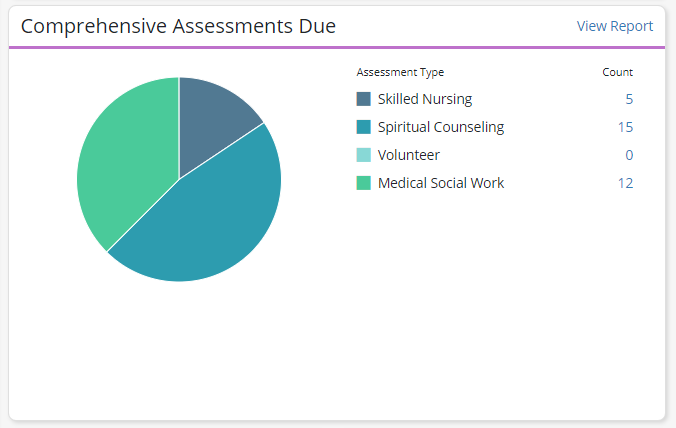
The Comprehensive Assessments Due tile displays the total number of comprehensive assessments due for each discipline.
On this tile, the pie chart provides an at-a-glance view of how many assessments for each discipline comprise the total number of comprehensive assessments due. Hover over any section of the pie chart to view the number of assessments due and the percentage of due assessments that fall under that discipline. Click on any section of the pie chart or select a number next to any discipline to view the Comprehensive Assessments Due report filtered by the selected discipline.
Click View Report to see the full Comprehensive Assessments Due report.
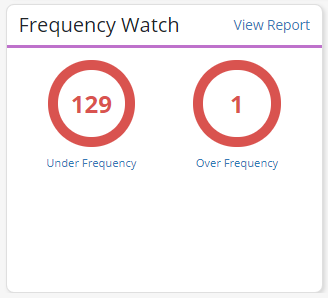
The Frequency Watch tile compares the number of scheduled versus ordered visits and displays a breakdown of tasks scheduled over or under the ordered frequency. Click on Under Frequency or Over Frequency to view the filtered Frequency Watch report, or click View Report to open the full report.
Updated on 9/03/2020