Axxess Hospice now provides five new statistical reports to help organizations gain valuable business insights and make informed decisions. The new reports include:
|
Average Daily Census |
|
|
Location of Care Provided |
|
|
Percentage of Care Days by Service Location |
|
|
Referral Conversion Rate |
|
|
Patient Mix by Diagnosis |
To access these reports, users must have permission to view statistical reports in Axxess Hospice.
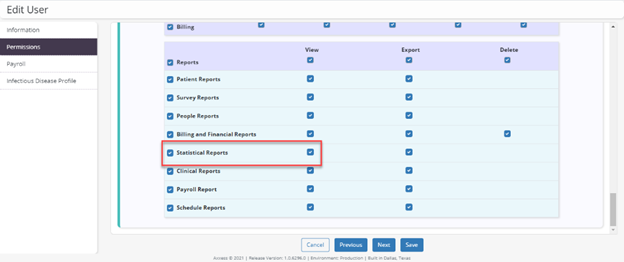
To give a user permission to view statistical reports, edit the user’s profile and navigate to the Permissions tab. In the Reports section, select View next to the Statistical Reports permission. Click Save to finish granting the permission to the user.
People tab ➜ People Center ➜ Edit ➜ Permissions tab ➜ Reports section ➜ Statistical Reports ➜ View ➜ Save
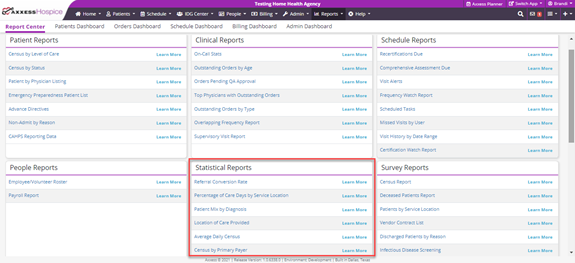
To access the statistical reports in Axxess Hospice, navigate to the Report Center under the Reports tab.
Reports tab ➜ Report Center ➜ Statistical Reports
The Average Daily Census report can be used to track the average number of patients cared for by your organization for a given date. This report is available for both hospice and palliative providers.
Once a user has navigated to the Statistical Reports section and selected the Average Daily Census report, the report will open in a new window with the following filters:
|
Date – This field defaults to the past 30 days. |
|
|
Branch – This field defaults to all. |
|
|
Team – This field defaults to all. |
To generate the report, select the desired options from the filters at the top of the screen and click Request Report. Once the report is generated, it can be exported to Excel.
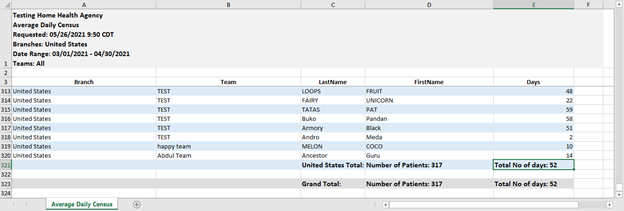
The report will include any patients that were active with the organization for the selected branch and team options in the given time frame. The report will include the following columns:
|
Branch – Displays the branch associated with the patient. |
|
|
Team – Displays the team associated with the patient. |
|
|
Last Name – Displays the patient’s last name. |
|
|
First Name – Displays the patient’s first name. |
|
|
Days – Displays the total number of days that the patient has been on service. |
The report data is summarized at the bottom of the report, with the following calculations for each branch and team selected in the report filters:
|
Number of Patients – Displays the total number of patients on service during the given time frame. |
|
|
Total Number of Days – Displays the total number of days (calculated by adding the days column for all patients). |
|
|
Days in the Period – Displays the number of days for which the report was generated. |
|
|
Average Census – Displays the average census (calculated by dividing the total number of days by the days in the period). If the number is a decimal, it will be rounded to the nearest whole number. |
The Location of Care Provided report displays the total number of days of care for a given time frame for each level of care. This report is available for hospice providers.
Once a user has navigated to the Statistical Reports section and selected the Location of Care Provided report, the report will open in a new window with the following parameter options:
|
Date – This field defaults to the past 30 days and is based on the service date. |
|
|
Branch – This field defaults to all. |
|
|
Team – This field defaults to all. |
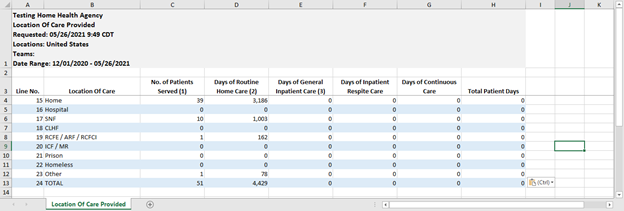
The report will generate automatically in the system but can be exported to Excel, if needed. Once generated, the report will include the following columns:
|
Line Number – Displays the line number provided by ALIRTS. |
|
|
Location of Care – Displays the location of care (as it needs to be listed out for ALIRTS) and defaults to sort descending A-Z. |
|
|
Number of Patients Served – Displays the total number of patients that were active with the organization during the selected time frame within the location of care. |
|
|
Days of Routine Home Care – Displays the total number of days of routine home care during the selected time frame within the location of care. |
|
|
Days of Inpatient Care – Displays the total number of days of inpatient care during the selected time frame within the location of care. |
|
|
Days of Inpatient Respite Care – Displays the total number of days of inpatient respite care during the selected time frame within the location of care. |
|
|
Days of Continuous Care – Displays the total number of days of continuous care during the selected time frame within the location of care. |
|
|
Total Care Days – Displays the total number of days of care provided for the entire time frame. |
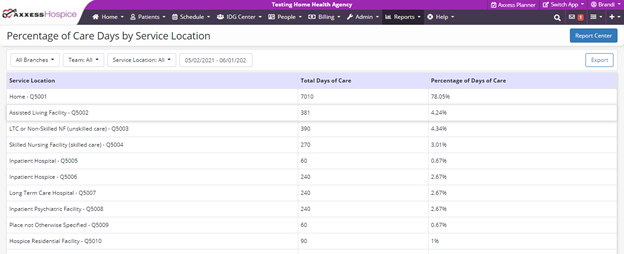
The Percentage of Care Days by Service Location report displays the total number of days of care by service location for a given time frame (for each service location). This report is available for both hospice and palliative care providers.
Once a user has navigated to the Statistical Reports section and selected the Percentage of Care Days by Service Location report, the report will open in a new window with the following filters:
|
Branch – This field defaults to all. |
|
|
Team – This field defaults to all. |
|
|
Service Location – This field defaults to all. |
|
|
Date Range – This field defaults to the past 30 days and is based on the service date. |
The report will generate automatically in the system but can be exported to Excel, if needed. Once generated, the report will include the following columns:
|
Service Location – Pulls from the preset list of service locations in Axxess Hospice and defaults to sort descending A-Z. |
|
|
Total Days of Care – Displays the total number of patient care days for each service location for the given time frame. |
|
|
Percent of Days of Care – Displays the percentage of days of care for the service location and time frame. This is calculated by dividing the days of care for each service location by the total number of days. |
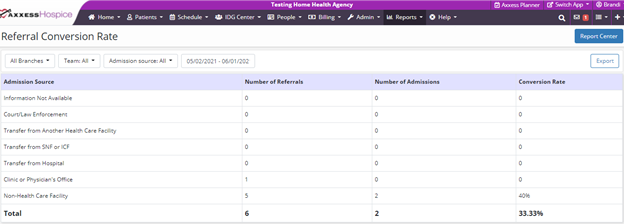
The Referral Conversion Rate report displays the number of referrals, admissions and conversion rates by admission source for a given time frame. This report is available for both hospice and palliative care providers.
Once a user has navigated to the Statistical Reports section and selected the Referral Conversion Rate report, the report will open in a new window with the following filters:
|
Branch – This field defaults to all. |
|
|
Team – This field defaults to all. |
|
|
Admission Source – This field defaults to all. |
|
|
Date – This field defaults to the past 30 days and is based on the service date. |
The report will generate automatically in the system but can be exported to Excel, if needed. Once generated, the report will include the following columns:
|
Admission Source – Displays the admission sources selected in the report filters and defaults to sort descending A-Z. |
|
|
Number of Referrals – Displays the number of referrals for the admission source within that row for the given time frame. |
|
|
Number of Admissions – Displays the number of admissions for the admission source within that row for the given time frame. |
|
|
Conversion Rate – Display as a percentage and is calculated by dividing the number of admissions by the number of referrals. |
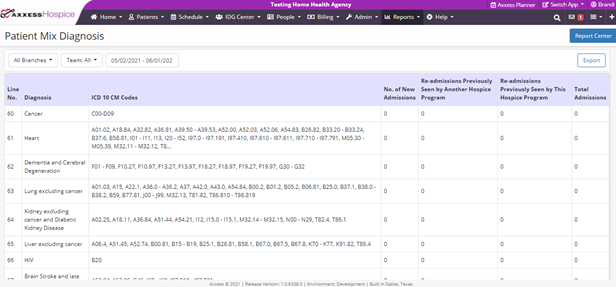
The Patient Mix by Diagnosis report displays the total number of admissions or re-admissions by diagnosis for a given time frame. This report is available for both hospice and palliative care providers.
Once a user has navigated to the Statistical Reports section and selected the Patient Mix by Diagnosis report, the report will open in a new window with the following filters:
|
Branch – This field defaults to all. |
|
|
Team – This field defaults to all. |
|
|
Date – This field defaults to the past 30 days and is based on the service date. |
The report will generate automatically in the system but can be exported to Excel, if needed. Once generated, the report will include the following columns:
|
Line Number – Displays the line number provided by ALIRTS. |
|
|
Diagnosis – Displays the diagnosis group (such as cancer, diabetes, etc.) and is based on the patient’s primary diagnosis. This will be mapped according to ALIRTS. |
|
|
ICD-10-CM Codes – Displays ICD codes that correspond to the diagnosis group for that row. |
|
|
Number of New Admissions – Displays the number of patients newly admitted to the organization for the given time frame and diagnosis group. |
|
|
Re-Admissions Previously Seen by Another Hospice Program – Displays the number of patients who have been admitted to the organization in the given time frame and who have previously received services with another organization. |
|
|
Re-Admissions Previously Seen by This Hospice Program – Displays the number of patients who have been admitted to the organization in the given time frame and who have previously received services with this organization. |
|
|
Total Admissions – Displays the total number of admissions in the given time frame for the diagnosis group. |
Updated on 06/09/2021