The Administrator Dashboard provides direct, real-time access to the data that matters most to hospice administrators. The data in the Admin Dashboard enables data-driven decision-making and provides valuable insight into all areas of clinical, operational and financial operations.
To view information in the Admin Dashboard, users must have permission to access the NOE, NOTR and claims.
To give a user permission to view the Admin Dashboard, edit the user’s profile and navigate to the Permissions tab. In the Billing section, select View next to the NOE, NOTR and Claims. Click Save to complete the process.
People tab ➜ People Center ➜ Edit ➜ Permissions tab ➜ Billing section ➜ NOE/NOTR/Claims ➜ View ➜ Save
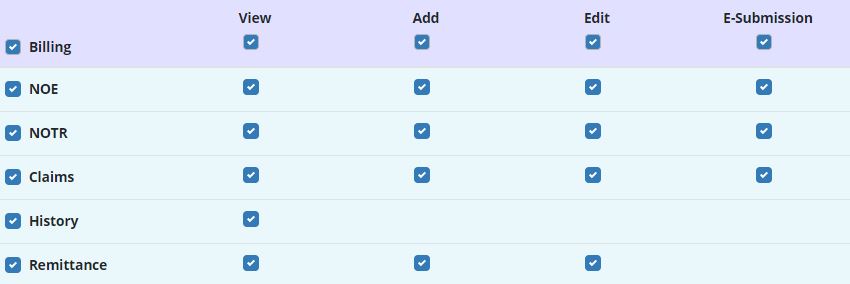
If these permissions are not granted, the user will not be able to see billing-related tiles in Axxess Hospice.
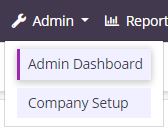
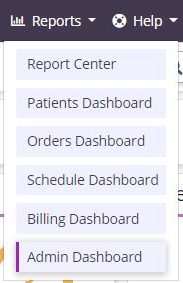
The Administrator Dashboard can be accessed from the Admin or Reports tab in the top menu bar.
The following seven tiles appear on the dashboard:
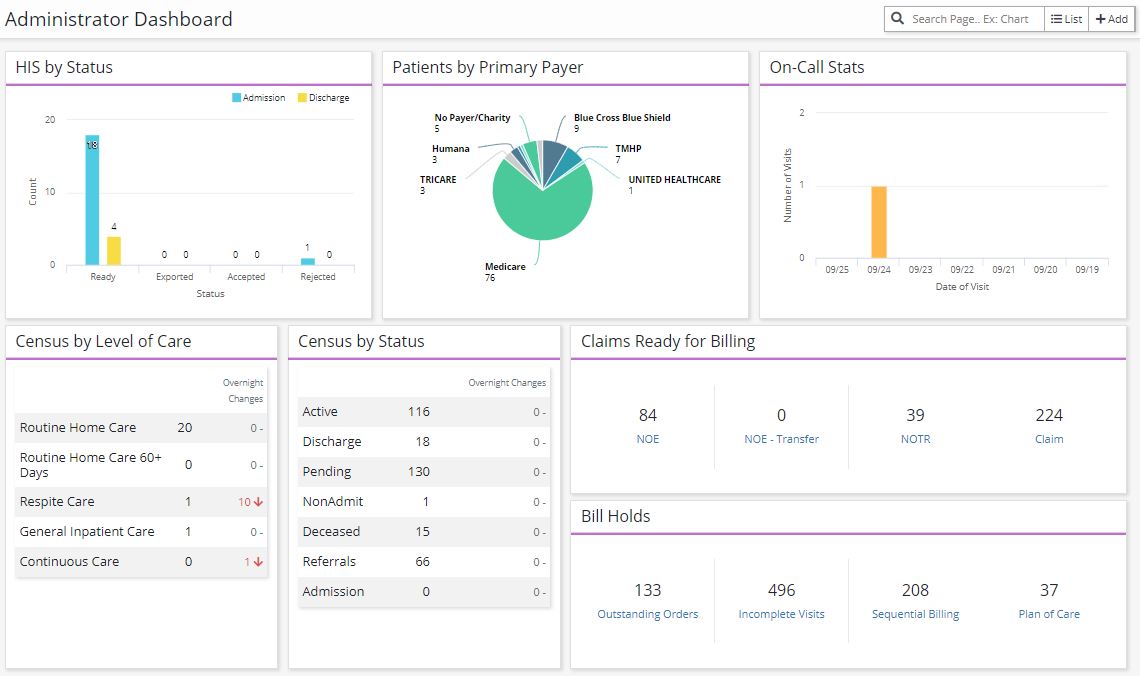
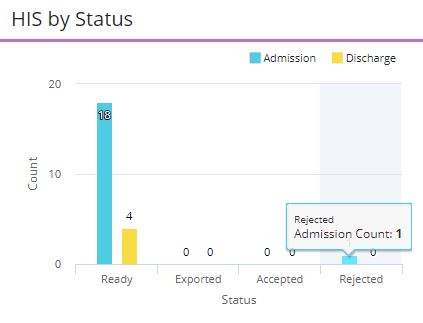
The HIS by Status tile shows a count of both Admission and Discharge HIS files by status. Statuses include Ready, Exported, Accepted, and Rejected. Hover over a bar on the graph to display the status, HIS type, and count for that category. Click on a bar to navigate directly to the HIS Export Manager for that category to view the files that fit that selection.
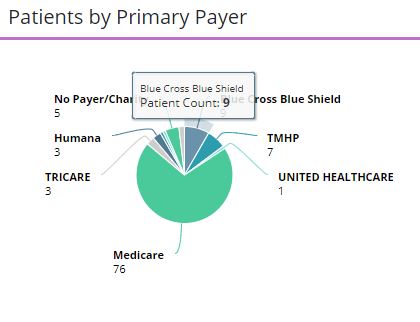
The Patients by Primary Payer tile shows a breakdown of the payer mix in the agency. Hover over a piece of the graph to see the payer name and patient count for that payer. Click on a portion of the graph to navigate directly to a list of patients with the selected payer and export or print the list if necessary.
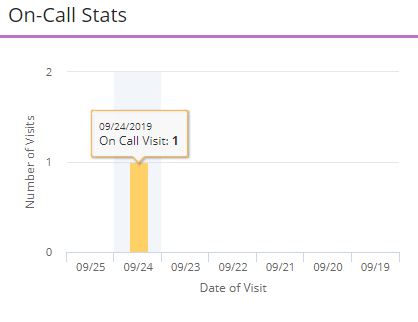
The On-Call Stats tile shows a count of the number of visits marked as on-call for the last seven days beginning with the current day. Hover over a bar in the graph to view the date and number of visits made on that day.
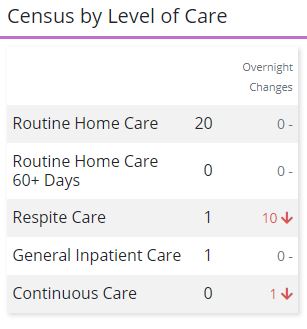
The Census by Level of Care tile shows a breakdown of the hospice’s active patients by level of care. Routine Home Care (RHC) patients are divided into two buckets to align with the tiered payment structure for RHC:
Overnight changes are highlighted, and any changes made after 5 PM local time the previous day appear on this tile.
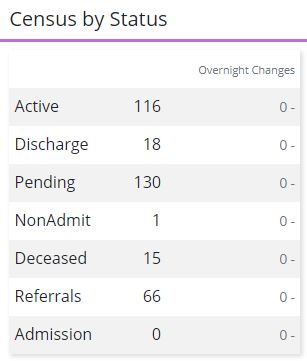
The Census by Status tile shows a breakdown of patients by status and any referrals and admissions. Overnight changes are highlighted, and any changes made after 5 PM local time the previous day appear on this tile.
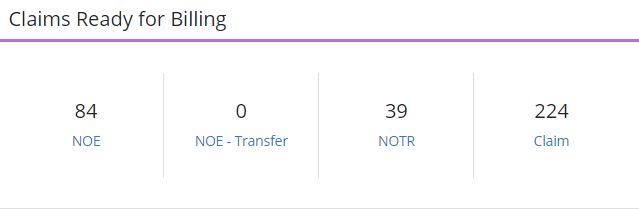
The Claims Ready for Billing tile shows a count of claims (by claim type) that are ready to be billed. Claim types include NOE (81A), NOE-Transfer (81C), NOTR, and Claims. This tile will not show any information unless billing permissions are granted to the user.
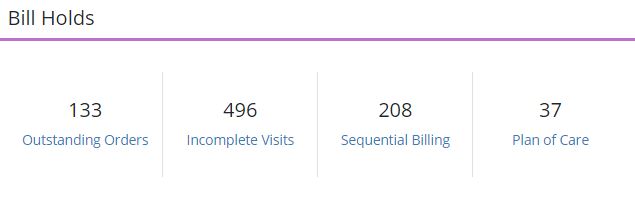
The Bill Holds tile shows a count of items that may prevent claims from going out for any of the following reasons: Outstanding Orders, Incomplete Visits, Sequential Billing, and Plan of Care. Orders that have not been returned as signed from the physician, visits from any discipline that have not been completed, claims that have been submitted out of sequence, or unsigned plans of care are tracked here and updated in real time.