
The PDGM Center displays targeted insights into the Patient-Driven Groupings Model with real-time aggregate data. Using the information in the PDGM Center, organizations can analyze critical components of PDGM, develop data-driven business decisions, review the impact of patient care, and assess the impact of PDGM on revenue. To access the PDGM Center, hover over the PDGM tab in AgencyCore and select PDGM Center from the drop-down menu.
From the PDGM Center, users can navigate directly to the PDGM Billing Center, Revenue Impact Analysis, PDGM Modeling Tool, and PDGM Resources screens to access the following functionalities for PDGM preparation:
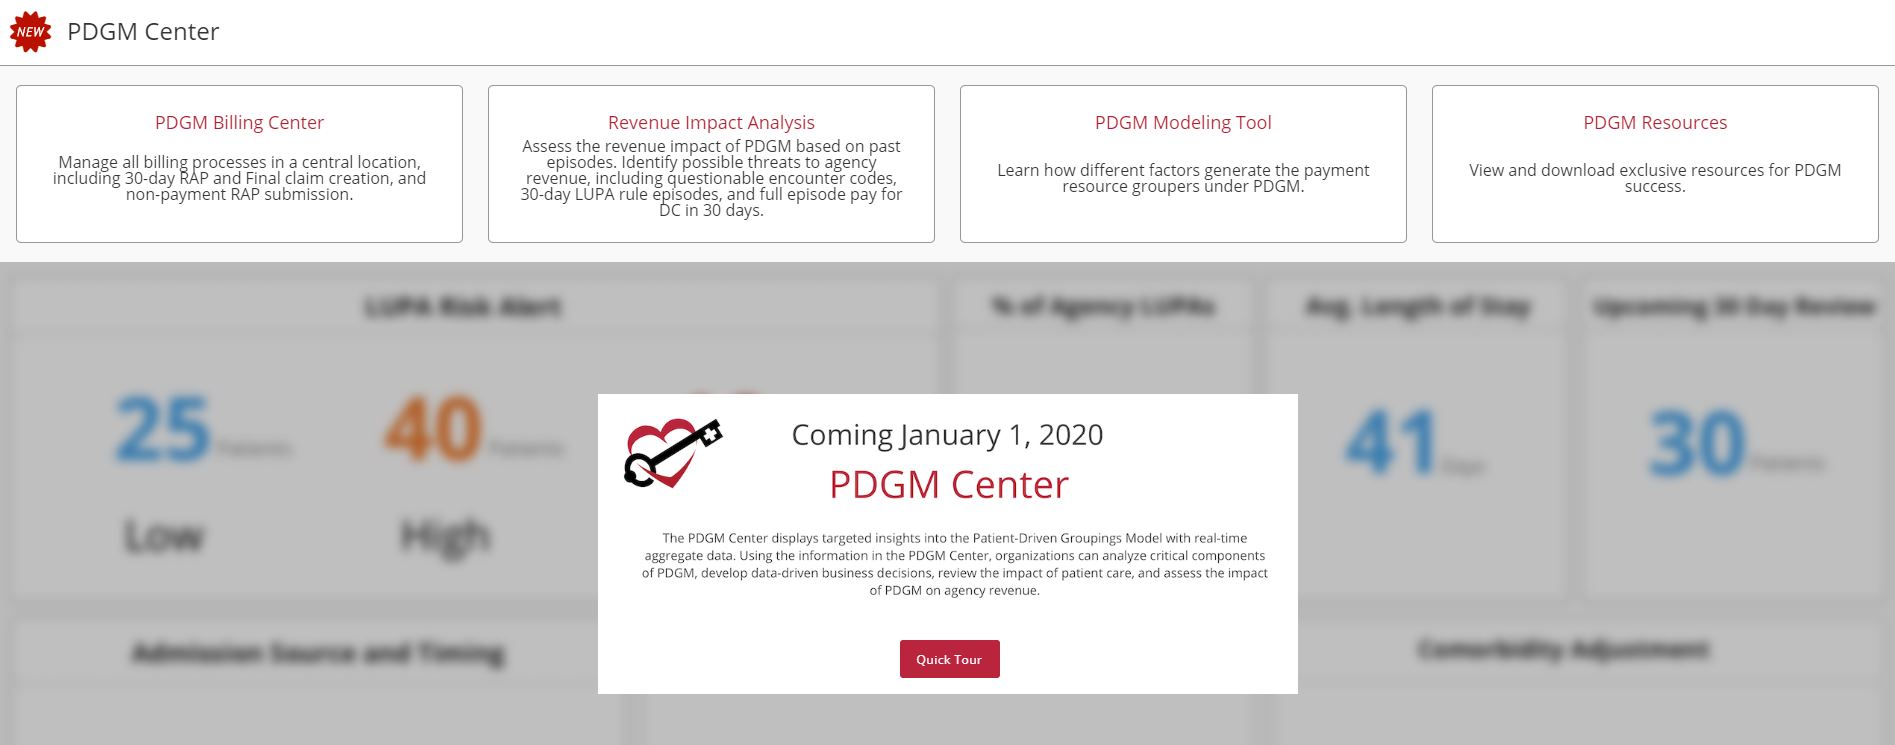
PDGM data will begin populating in the following PDGM Center feature tiles beginning January 1, 2020:
| Tile | Description |
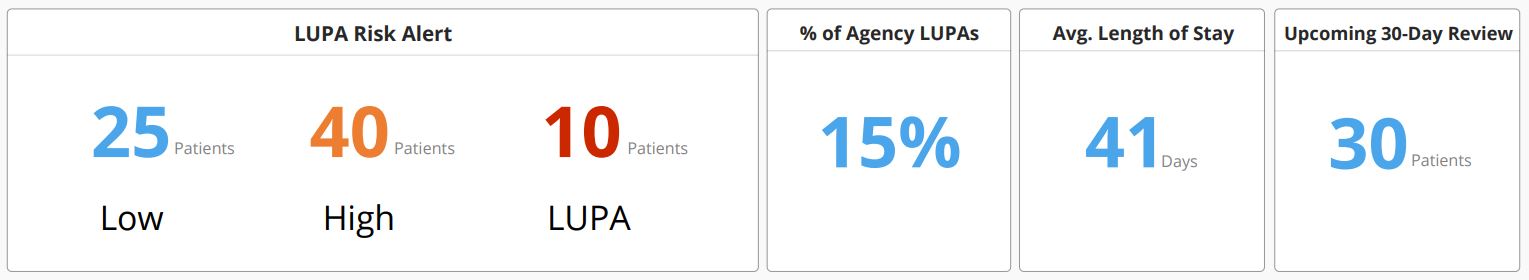
| LUPA Risk Alert | Users receive LUPA risk alerts when scheduled visits fall outside a specified threshold. This tile displays the number of at-risk patients categorized by low LUPA risk, high LUPA risk, and LUPAs. |
| % of Agency LUPAs | Displays the agency’s percent of LUPAs in real time |
| Avg. Length of Stay | Displays the agency’s average length of stay in real time |
| Upcoming 30-Day Review | Users receive alerts as patients enter the last seven days of the first 30-day billing period. This tile enables users to review the focus of care and verify completion of all orders, visits and documentation to submit final claims in a timely manner. |
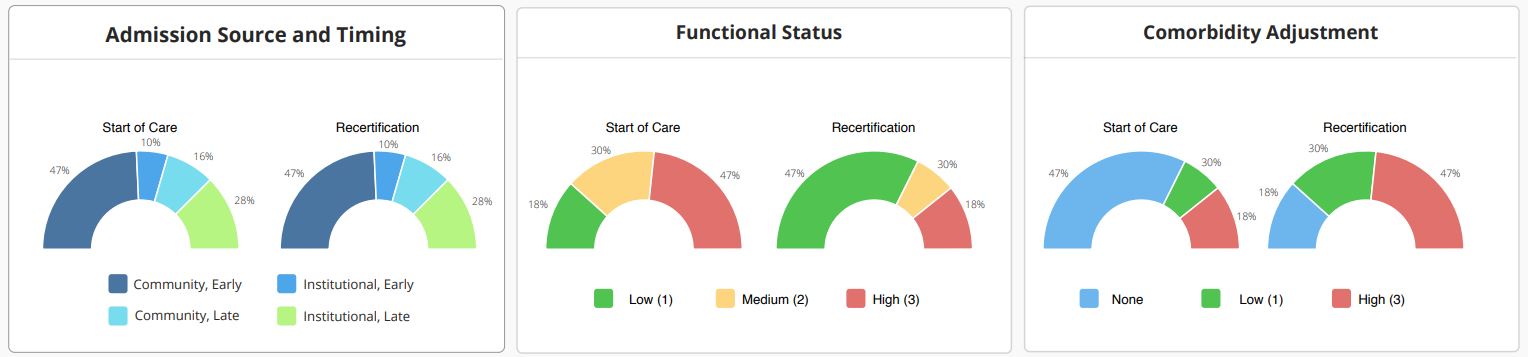
Users can view components of the Home Health Resource Group (HHRG), including admission source and timing, functional score, and comorbidity adjustment data in the following respective tiles:
| Admission Source and Timing | Displays the percentage of early vs. late and institutional vs. community patients |
| Functional Status | Displays the percentage of patients at each functional status (high, medium, low) at Start of Care and Recertification |
| Comorbidity Adjustment | Displays the percentage of comorbidity adjustments (high, low, none) at Start of Care and Recertification |
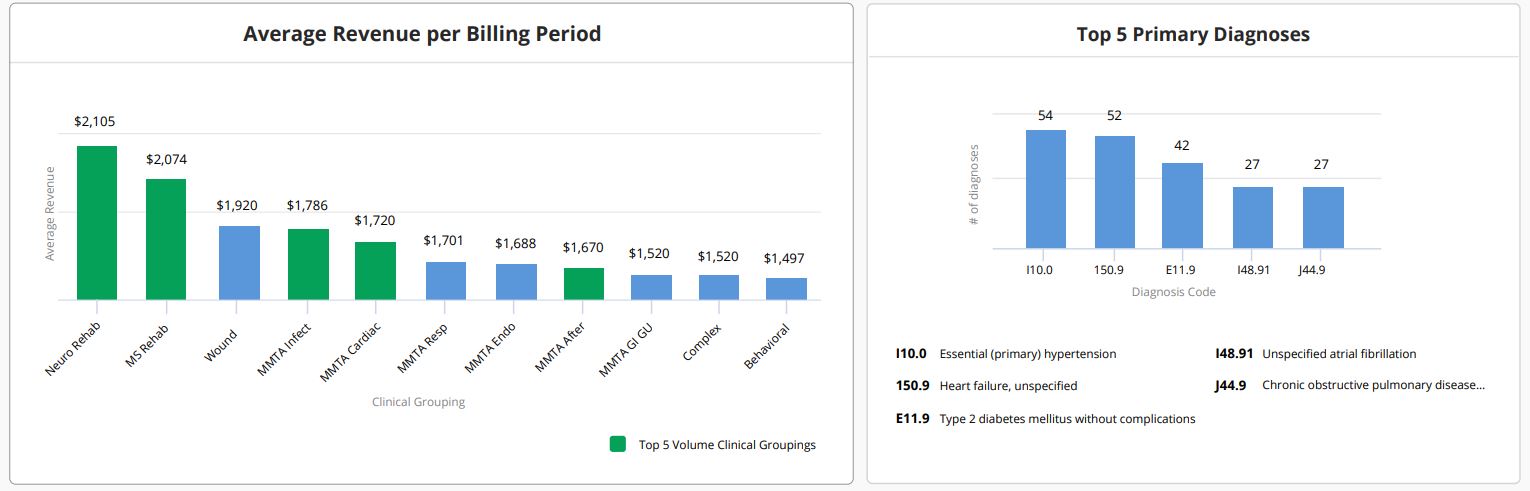
| Average Revenue per Billing Period | Displays expected revenue for each billing period sorted by clinical grouping |
| Top 5 Primary Diagnoses | Displays the agency’s five most commonly used diagnoses, and how many times the agency has used each of the top five diagnoses, in a bar graph for easy at-a-glance review |
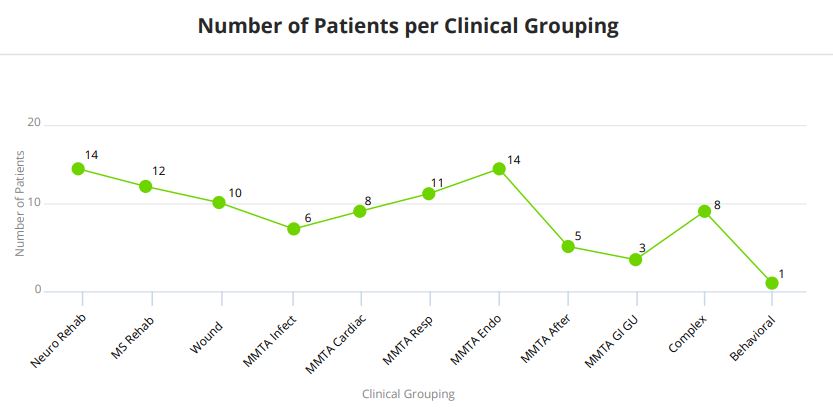
| Number of Patients per Clinical Grouping | Displays the number of patients in each clinical grouping in real time |