The PDGM Center, powered by Axxess intelligence™, displays targeted insights into the Patient-Driven Groupings Model with real-time aggregate data. Using the information in the PDGM Center, organizations can analyze critical components of PDGM, develop data-driven business decisions, review the impact of patient care and assess the impact of PDGM on revenue. The PDGM Center is updated nightly to give you the most up-to-date insights.
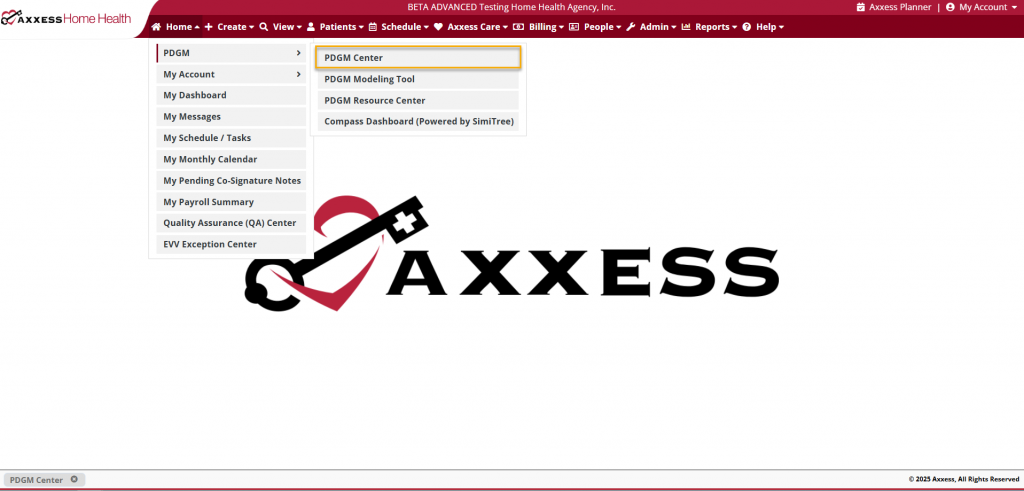
To access the PDGM Center, hover over the PDGM tab and select PDGM Center from the drop-down menu.
At the top of the PDGM Center, users can navigate directly to the Billing Center, Revenue Impact Analysis, PDGM Modeling Tool, PDGM Resource Center, and PDGM Center Patient List screens.
Billing Center – Manage all billing processes in a central location, including 30-day RAP and Final claim creation, and non-payment RAP submission.
Revenue Impact Analysis – Assess the revenue impact of PDGM based on past episodes. Identify possible threats to agency revenue, including questionable encounter codes, 30-day LUPA rule episodes, and full episode pay for DC in 30 days.
PDGM Modeling Tool – Learn how different factors generate the payment resource groupers under PDGM.
PDGM Resource Center – View and download exclusive resources for PDGM success.
View PDGM Center Patient List – View a list of all patients impacted by PDGM with drill-down details for data analysis throughout care episodes.

PDGM data will begin populating in the following PDGM Center feature tiles as OASIS-D1 assessment documentation is collected, and scheduling and billing are completed. As this data accumulates, metrics will populate in the appropriate sections of the PDGM Center.
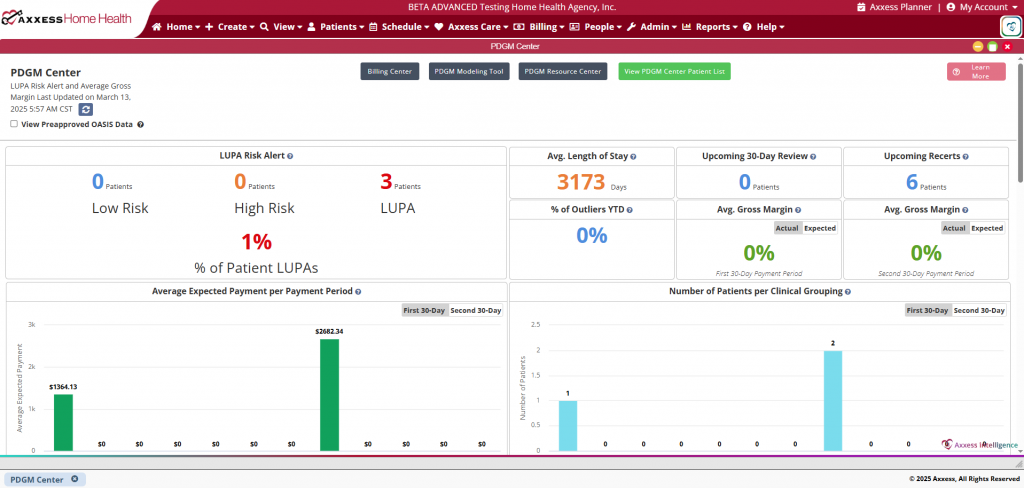
LUPA risk alerts occur when scheduled visits fall outside the specified visit threshold for the 30-day payment period. Users can select the numbers under Low Risk, High Risk, and LUPA to view patients that fall into that category.
Select the number of patients above Low Risk, High Risk, or LUPA to view a detailed drill-down for the respective patients.
Displays the average number of days from the Start of Care date to the current date for all patients under PDGM in real time.
Displays the total number of patients in the last seven days of the first 30-day payment period. This metric enables agencies to review the focus of care and verify completion of all orders, visits, and documentation to submit final claims in a timely manner. Users can click the number under Upcoming 30-Day Review to view patients that fall into this category.
Select the number of patients on this tile to view detailed drill-down data for all patients with upcoming 30-day reviews.
Displays the the total number of patients in the last seven days of the second 30-day payment period. This metric enables agencies to review the focus of care to determine if patients should be recertified or discharged, and verify completion of all orders, visits, and documentation to submit final claims in a timely manner. Users can click the number under Upcoming Recerts to view patients that fall into this category.
Select the number of patients on this tile to view detailed drill-down data for all patients with upcoming recertifications.
Displays the percentage of patients identified as outliers.
Users can click the percentage to view patients identified as outliers.
Select the percentage on this tile to view detailed drill-down data for all patients identified as outliers.
First 30-Day Payment Period
Displays the average gross margin for the first 30 days, which is calculated by subtracting the total cost for all patients with completed episodes for the first 30-day period from the average expected payment.
Second 30-Day Payment Period
Displays the average gross margin for the second 30 days, which is calculated by subtracting the total cost for all patients with completed episodes for the second 30-day period from the average expected payment.
Displays the average revenue for all patients under PDGM for each 30-day payment period. Click numbers on the graph to view detailed data for patients in the respective category.
Displays the number of patients under PDGM per clinical grouping. The top five clinical groupings with the highest volume of patients appear in green. Click numbers on the graph to view detailed data for patients in the respective category.
Displays the percentage of early vs. late and institutional vs. community patients. Click sections on the graph to view detailed data for patients in the respective category.
Displays the percentage of patients at each functional status (high, medium, low) at Start of Care and Recertification. Click sections on the graph to view detailed data for patients in the respective category.
Displays the percentage of comorbidity adjustments (high, low, none) at Start of Care and Recertification. Click sections on the graph to view detailed data for patients in the respective category.
Displays the average expected revenue for all patients under PDGM for each 30-day billing period. Click numbers on the graph to view detailed data for patients in the respective category.
Displays displays the average number of visits completed per 60-day episode for each clinical grouping, once the care episode has ended. Click numbers on the graph to view detailed data for patients in the respective category.