The PDGM Dashboard empowers agencies with continuous access to real-time episode data, so users can evaluate key aspects of care delivery for streamlined intra-episode management. Using the PDGM Dashboard, agencies can manage patients upfront, perform chart reviews, and assess the delivery of care improvement in real time instead of performing post-audit reviews.
Clinical and case managers can quickly review the effectiveness and efficiency of care to make timely decisions and improve clinical and financial outcomes. By facilitating seamless collaboration of all disciplines, the PDGM Dashboard streamlines case conferences and case management processes.
The PDGM Dashboard is accessible to all users with a role of Case Manager or higher (Clinical Managers, Administrators, etc.).
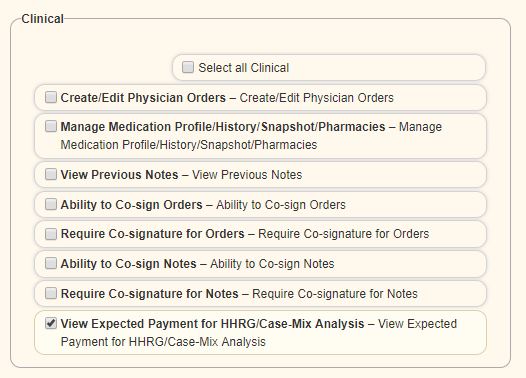
Financial information on the PDGM Dashboard is visible based on the user’s financial permissions. To give a user permission to view financial information, navigate to the Permissions tab in the user’s profile and select the View Expected Payment for HHRG/Case-Mix Analysis permission in the Clinical section.
View tab ➜ Lists ➜ Users ➜ Edit ➜ Permissions tab ➜ Clinical section ➜ View Expected Payment for HHRG/Case-Mix Analysis
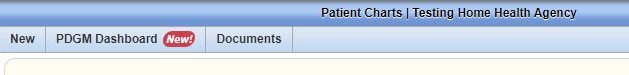
To access the PDGM Dashboard, navigate to the Patient Charts and select the PDGM Dashboard tab. Patients tab ➜ Patient Charts ➜ PDGM Dashboard tab
The PDGM Dashboard can also be accessed through the PDGM Center when a patient is selected from the list of sorted patients. PDGM tab ➜ PDGM Center
The following tiles appear on the PDGM Dashboard:
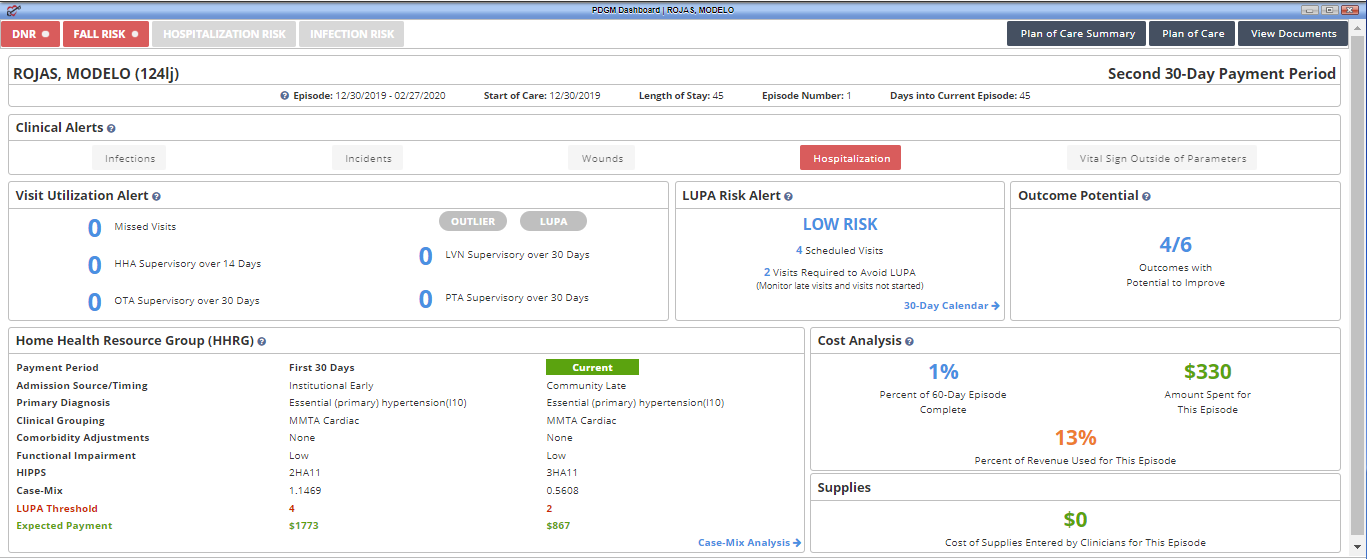
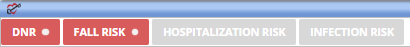
Risk Stratification– Identifies the patient’s risk level during the comprehensive assessment visit (i.e., OASIS). Fall, hospitalization, and infection risks are identified and updated at recertification. DNR patients are also identified to alert clinicians entering the patient’s home. DNR status can be updated using the following path: Patients tab ➜ Patient Chart ➜ Edit ➜ Advance Directives
Plan of Care Summary– Provides current details of the patient’s visit frequency, medications, and treatment orders. Once the Plan of Care is approved by QA, the Plan of Care Summary is created and updated through physician orders or subsequent comprehensive assessments in real time.
Plan of Care– Once the Plan of Care is approved by QA, the Plan of Care that was sent to the physician is now available to view. The Plan of Care is updated at recertification or Other Follow-Up (SCIC- Significant Change in Condition).
View Documents– Enables users to see and access documents attached to the patient chart.
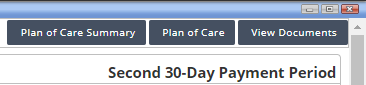
The PDGM Dashboard header displays the patient’s name, MRN, and the following time period information:

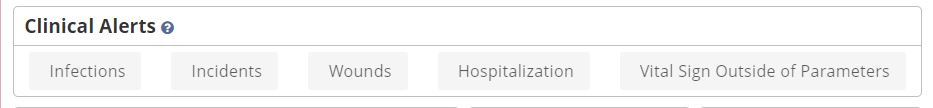
Users receive the following clinical alerts:
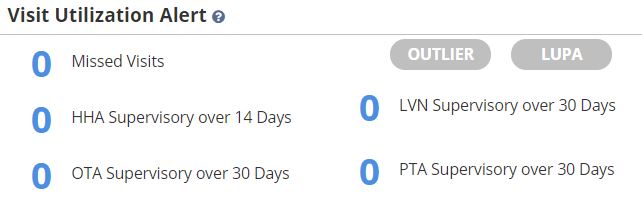
Visit utilization alerts apply to all patients under PDGM. If the patient has been identified as a LUPA or outlier by the comprehensive assessment, the appropriate label will appear in red on this tile. Additional visit alerts include:
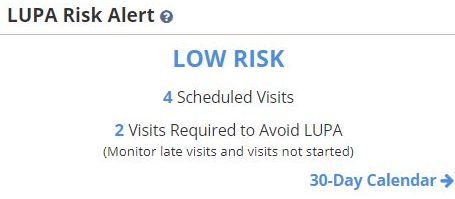
LUPA risk alerts occur PDGM when scheduled visits fall outside the specified visit threshold for the 30-day payment period.
Select 30-Day Calendar to view visit statuses for the entire 30-day payment period. This functionality enables agencies to view the total number of visits ordered compared to visit statuses at a glance.
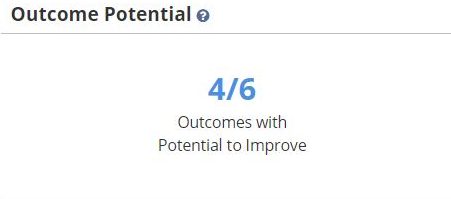
Outcomes with the potential to improve are determined based on information documented in the OASIS. The total number of outcomes versus the total number of outcomes with potential for improvement are displayed in this tile. Outcomes that are excluded based on responses in the OASIS assessment are not represented here. Outcome potential is updated each episode.
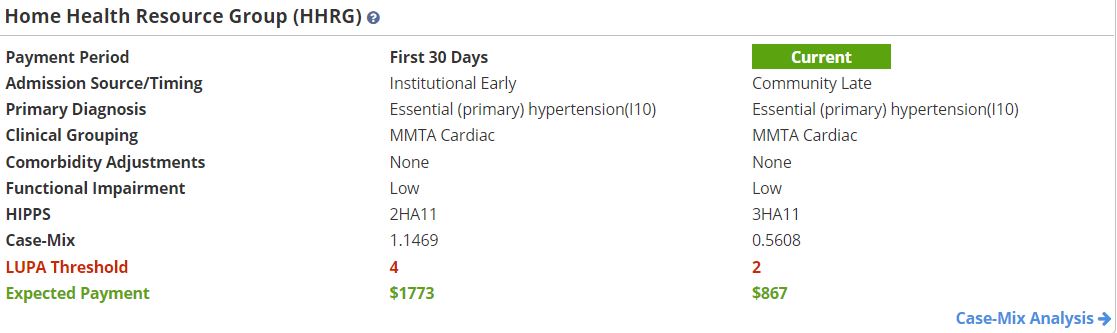
Home Health Resource Group (HHRG) information for the first and second 30-day payment periods appears on completion of the OASIS assessment and updates on completion of subsequent OASIS assessments. Completion of a Change in Focus form also updates the HHRG information on the PDGM Dashboard.
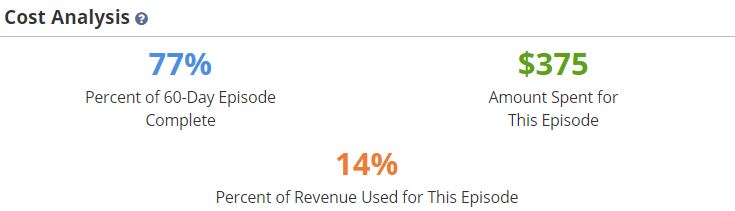
Displays the percentage of the episode that has been completed, the cost of care, and the percent of revenue spent to date.
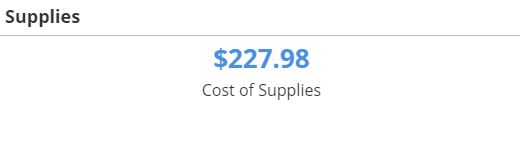
Displays the cost of supplies for each 30-day payment period based on supply worksheets documentation. Supplies can be entered through clinical notes and through the Billing Center.
Updated on 2/14/2020