The PDGM Dashboard provides real-time data for managing the care process. Visit utilization is vital to prevent LUPAs and maintain effective cost containment.
To access the PDGM Dashboard, navigate to the Patient Charts and select the PDGM Dashboard tab.
Patients tab ➜ Patient Charts ➜ PDGM Dashboard tab
The PDGM Dashboard can also be accessed through the PDGM Center when a patient is selected from the list of sorted patients. PDGM tab ➜ PDGM Center
A Frequency & Duration section has been added to the PDGM Dashboard.
Color-coding enables quick and easy review of visit statuses. Frequencies can be updated through the Frequency & Duration tab in a physician order or through a comprehensive OASIS assessment.
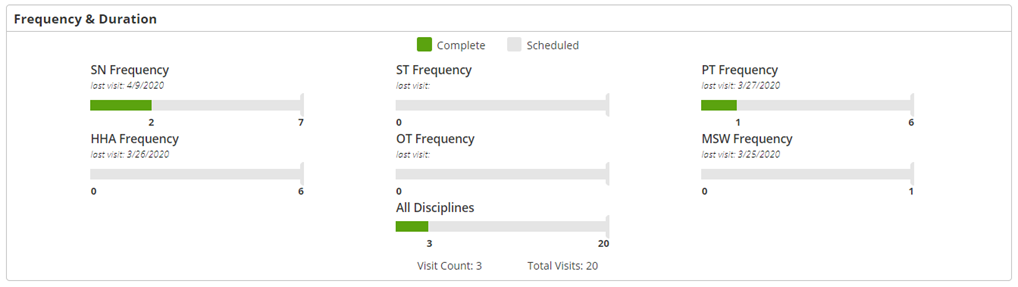
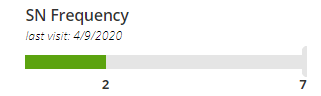
Scheduled visits for each discipline are represented by the gray bar on each graph. The total number of scheduled visits is identified at the end of the bar.
The green bar and corresponding number represent the total number of visits that have been completed.
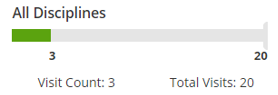
The All Disciplines graph shows the total number of scheduled and completed visits for all disciplines.
Updated on 3/31/2020