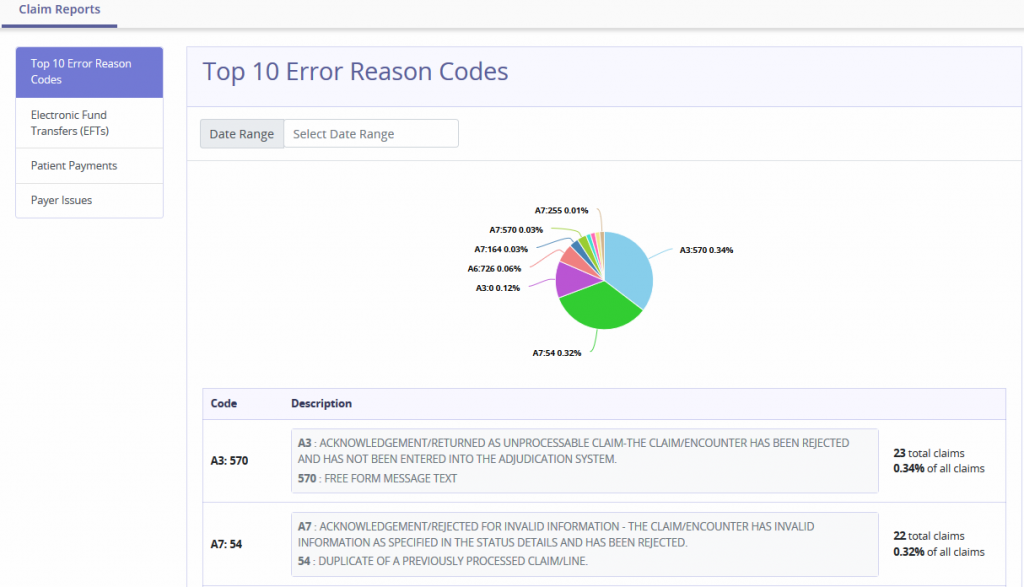
The pie chart displays statistical data of the most common error codes. Hovering over the graph displays the following details:
This report displays Electronic Fund Transfers (EFTs) that have been paid for the previous seven days and future dates.
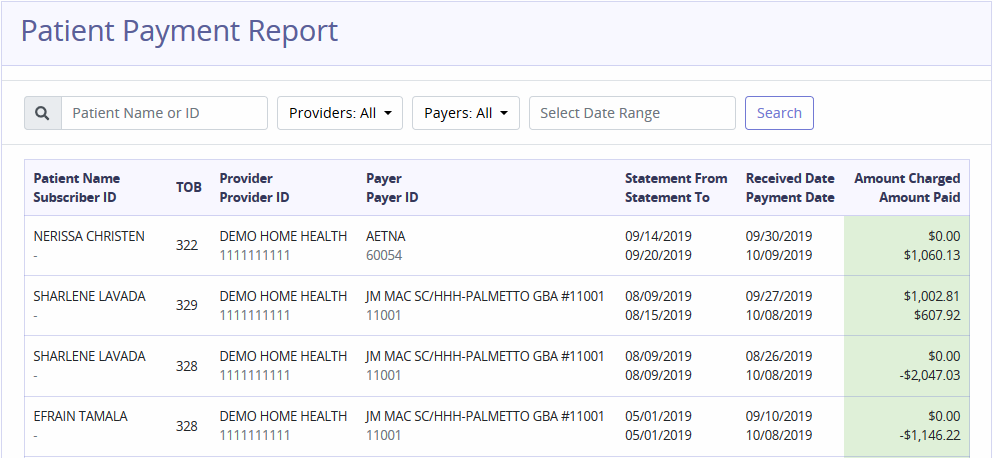
The report shows patient payment advices. Filter by entering Patient Name/ID, choosing Providers, Payers and/or Date Range.
This report shows issues of payers. To filter, choose Payers/Statuses and enter the Date Range.